
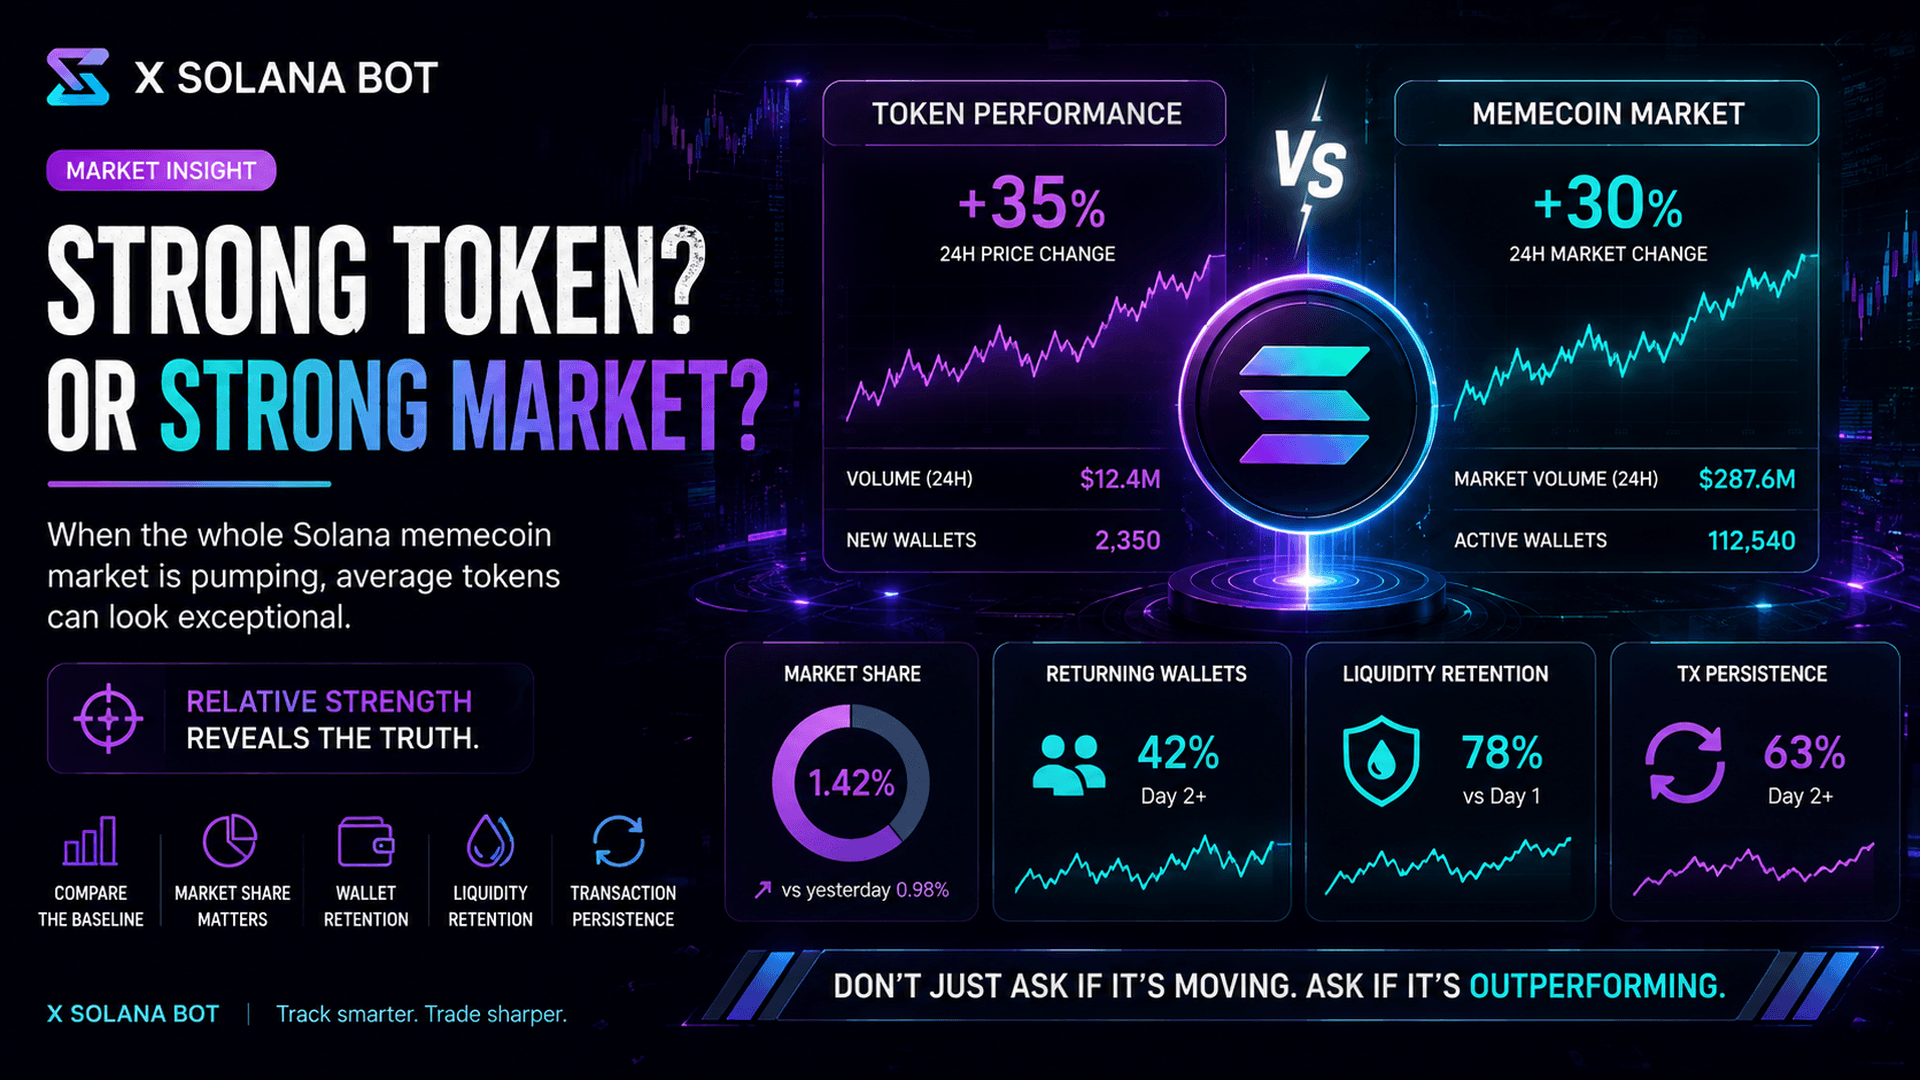
A Solana memecoin can show rising volume, accelerating wallet growth and impressive price performance without actually outperforming anything. When the entire memecoin ecosystem enters a high-activity phase, average tokens begin producing metrics that would look exceptional in a quieter market. This creates an important analytical problem: traders need to separate token-specific strength from market-wide momentum.
Why a hot market changes the meaning of token data
Solana memecoin analysis is usually performed at the individual-token level. A trader opens a dashboard, evaluates volume, liquidity, holder activity and recent price action, then decides whether the token looks stronger or weaker than expected.
The weakness of this approach is that those numbers do not exist in isolation.
A token generating $5 million of daily volume during a quiet market can represent something fundamentally different from the same token generating $5 million while hundreds of competing memecoins are experiencing similar increases in activity.
The raw number has not changed. Its significance has.
This becomes especially important during periods when capital rotates aggressively into the entire Solana memecoin sector. More traders become active, dormant wallets return, launchpad activity increases and speculative capital spreads across a much larger number of tokens. In that environment, almost every meaningful metric receives a natural boost.
Volume increases. Transactions increase. Wallet acquisition increases. Liquidity moves more quickly.
A trader looking only at absolute numbers can therefore confuse market-wide expansion with token-specific strength.
Market beta versus token alpha
Traditional finance uses the concepts of beta and alpha to distinguish performance caused by the wider market from performance specific to an individual asset or strategy. The same conceptual framework can be extremely useful in memecoin analysis.
Market beta describes the part of a token's performance that can reasonably be explained by the environment around it. If the entire Solana memecoin market is experiencing accelerating volume and speculative demand, an individual token should naturally benefit from that activity.
Token alpha is different. It describes the strength that remains when the market environment is taken into account.
Imagine two tokens both increase their trading volume by 40 percent.
At first glance, their performance appears identical.
But suppose the wider Solana memecoin market increased its volume by 35 percent during the same period. The first token is largely moving with the market.
Now imagine that another token increases its volume by 180 percent during the same 35-percent market expansion while also gaining wallet share and maintaining liquidity.
Those two situations should not receive the same analytical interpretation.
The purpose of relative analysis is not to calculate a perfect financial alpha statistic for every memecoin. The objective is simpler: establish an appropriate baseline before deciding whether a metric is genuinely impressive.
Why volume becomes especially deceptive during market-wide rallies
Trading volume is one of the easiest metrics to misread when the market becomes active.
A rapidly increasing volume chart naturally attracts attention. It suggests that traders are discovering the token, capital is entering and interest may be accelerating.
But volume can increase simply because there is more speculative activity everywhere.
When total Solana memecoin volume expands significantly, individual tokens benefit from a larger pool of active capital. Traders rotate between projects more frequently, bots execute more transactions and launchpads distribute more opportunities into the market.
This means volume growth needs context.
Instead of asking only whether token volume is increasing, an analyst can compare that growth with the broader market. If the token's activity is expanding significantly faster than the sector baseline, the signal becomes more interesting.
If the token is growing at approximately the same rate as everything else, its apparent strength may simply reflect favourable market conditions.
Market share can reveal more than raw volume
One useful way to introduce relative analysis is to observe a token's share of activity.
Suppose the total Solana memecoin market becomes twice as active. A token that doubles its own trading volume has technically produced significant growth, but it has not gained any relative importance.
Its share of the market remains approximately the same.
A token whose trading volume grows four times while the wider market doubles is doing something different. It is capturing a larger proportion of available attention and capital.
This distinction matters.
Raw volume tells traders how much activity exists. Market share helps show whether the token is becoming more important relative to competitors.
The same principle can be applied to transaction counts, new wallets and other behavioural metrics.
Wallet growth also needs a benchmark
Wallet acquisition can create a similar illusion.
During a broad speculative cycle, thousands of wallets that were previously inactive may return to the Solana ecosystem. These participants rarely buy only one token. They rotate between narratives, launchpads and trending opportunities.
As a result, an individual token can experience impressive wallet growth without necessarily demonstrating exceptional demand.
A better analysis asks whether the token is attracting wallets faster than comparable projects and whether those wallets remain involved.
This second part is especially important.
Market-wide enthusiasm can bring wallets into a token once. Retention shows whether the token managed to convert that temporary exposure into continued participation.
Combining relative acquisition with wallet retention provides a stronger signal than looking at first-time holder growth alone.
Liquidity quality becomes more important when capital is abundant
A hot market can also make liquidity appear healthier than it really is.
When speculative capital is abundant, liquidity flows toward a wide range of tokens. Pools grow, trading becomes easier and temporary market depth can improve.
The problem appears when the wider market cools.
Tokens that only attracted liquidity because the entire ecosystem was expanding may lose it quickly. Tokens with stronger individual participation may retain a greater percentage of their liquidity even as overall activity declines.
This means analysts should look at both liquidity growth and liquidity retention.
How quickly is liquidity entering compared with similar tokens?
How stable is that liquidity after the first wave?
Does liquidity survive periods when overall market activity slows?
The answers help distinguish temporary abundance from more durable market structure.
Relative strength becomes most valuable when everything looks good
During difficult market conditions, weak tokens are relatively easy to identify. Activity disappears, liquidity contracts and charts deteriorate.
The analytical challenge becomes much greater when almost everything looks positive.
When the wider market is expanding, weak and average projects can temporarily display strong-looking data. Green charts create visual confirmation. Rising volume creates urgency. Large transaction counts produce the impression of momentum.
This is precisely when relative analysis becomes most valuable.
A strong market lowers the usefulness of simply asking whether something is improving. Most assets may be improving.
The better question becomes: which tokens are improving faster, retaining more activity and capturing a greater share of the expanding market?
That distinction turns a market scanner into a comparative analytical system.
What happens when the market cools?
Broad market strength does not continue indefinitely.
Eventually, speculative activity slows. Volume declines, traders rotate elsewhere or broader crypto conditions change. This cooling phase can reveal which tokens were genuinely strong and which simply benefited from favourable conditions.
A token that loses nearly all of its activity as the sector contracts may have been highly dependent on market beta.
A token that retains a disproportionate share of wallets, liquidity and transactions may demonstrate stronger independent demand.
This creates another useful analytical concept: downside relative strength.
Outperformance is not always about rising faster.
Sometimes it means declining less.
A memecoin retaining 70 percent of its activity while the broader segment loses half of its volume may be producing a more meaningful signal than a token posting an aggressive gain during an ecosystem-wide rally.
Building a market-relative memecoin score
For an analytical platform such as XSolanaBot, relative data can become another layer of token evaluation.
Instead of showing only that a token's volume increased 80 percent, the platform can provide context about how the wider memecoin market behaved during the same period.
Wallet growth can be compared with the ecosystem baseline. Liquidity retention can be evaluated against similar tokens. Transaction persistence can be ranked relative to projects launched within the same timeframe.
This could lead to a market-relative score combining several dimensions of behaviour.
The objective would not be to predict price.
It would be to answer a more useful analytical question:
Is this token behaving unusually well given the current market environment?
That is fundamentally different from simply asking whether the token's metrics are positive.
Comparable tokens matter too
The broad Solana memecoin market is not always the most useful benchmark.
A newly launched token should not necessarily be compared directly with an established memecoin that already has substantial liquidity and a mature holder base.
Better comparisons can be created using cohorts.
Tokens launched within the same period can be compared with each other. Projects at similar liquidity levels can form another cohort. Tokens emerging from the same launchpad or operating within the same narrative can provide additional benchmarks.
This creates a more realistic baseline.
If ten comparable tokens launched within two hours and one maintains significantly stronger wallet retention, liquidity and transaction flow after 48 hours, that difference becomes analytically valuable.
The token is no longer simply “doing well.”
It is doing better than comparable alternatives facing similar market conditions.
Context turns raw data into intelligence
The broader lesson goes beyond memecoins.
Data becomes valuable when it has context.
A million dollars of volume is neither inherently large nor small. A thousand new wallets are neither inherently impressive nor weak. A 20-percent increase in liquidity means little without understanding what similar tokens and the wider market are doing.
This is why professional analysis depends on baselines.
Absolute metrics describe a token.
Relative metrics help evaluate it.
Both layers matter.
Final thoughts
During a strong Solana memecoin cycle, nearly every dashboard becomes more exciting. Volume increases, wallets return and charts begin moving faster.
That environment creates opportunity, but it also makes analysis more difficult.
A token can appear exceptional while simply participating in a broad market expansion.
The solution is not to ignore absolute metrics. It is to give them context.
Compare token growth with market growth. Compare wallet acquisition with similar projects. Measure whether the token captures additional activity and whether that activity remains when broader conditions change.
Because when the entire market is moving, the most important question is no longer:
“Is this token strong?”
It is:
“Is this token stronger than the market around it?”