
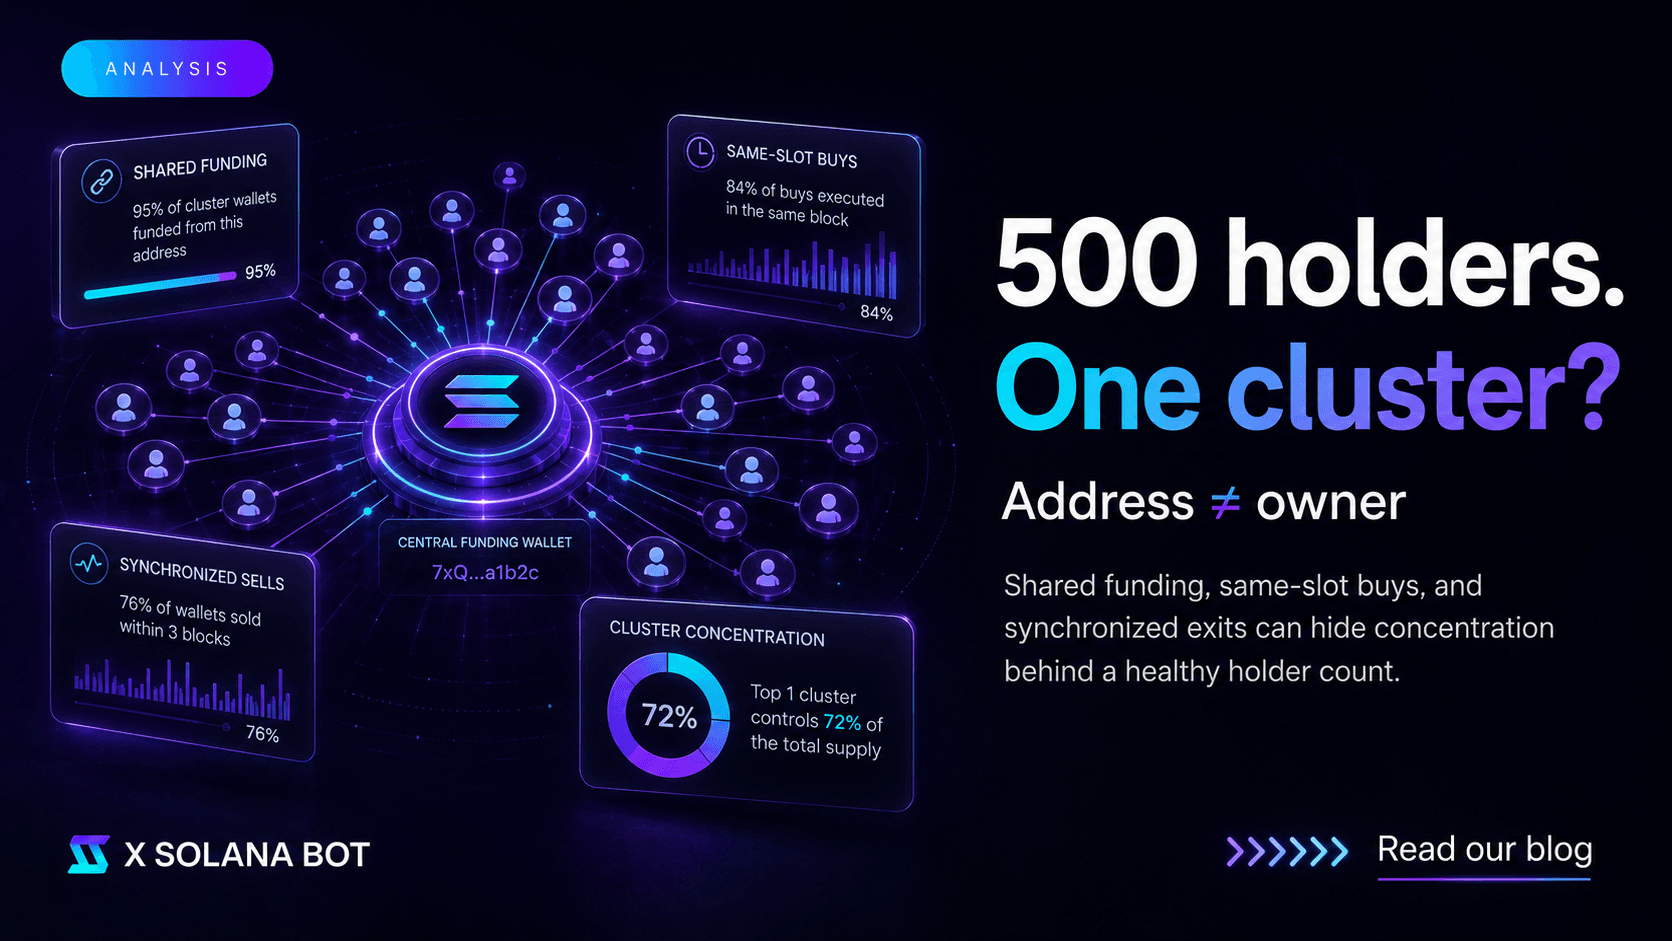
A Solana memecoin may display hundreds or even thousands of holders and still have a dangerously concentrated ownership structure. Standard holder tables count blockchain addresses, but they cannot automatically determine whether those addresses belong to independent market participants. To evaluate the real distribution of a token, traders need to look beyond wallet counts and analyse funding relationships, transaction timing and coordinated behaviour.
A holder count is not the same as ownership diversity
Holder count is one of the first metrics traders examine when analysing a new Solana memecoin. A growing number of holders appears to suggest that participation is expanding and the token is becoming more widely distributed.
The metric is useful, but its meaning is often overstated.
A blockchain records addresses rather than verified individual identities. One person, development team or coordinated organisation can control many wallets simultaneously. From the perspective of a basic holder table, each wallet appears to be a separate participant even when several addresses are funded, operated and eventually emptied by the same entity.
This creates an important distinction between address distribution and ownership distribution. A token can be distributed across many addresses while remaining economically concentrated within a small number of coordinated clusters.
For traders, the practical question is therefore not only how many wallets hold the token. It is how many genuinely independent actors those wallets represent.
What transaction bundles are on Solana
Solana’s infrastructure supports highly advanced transaction execution. Jito bundles, for example, allow several transactions to be submitted together and executed sequentially within the same slot. Their execution is atomic, meaning that the complete bundle succeeds or none of its transactions are committed.
This technology has legitimate uses. Traders and applications use bundles for arbitrage, transaction protection and other strategies requiring predictable execution. The existence of a bundle should not automatically be treated as evidence of manipulation.
However, similar infrastructure can also be used during memecoin launches to coordinate multiple purchases before ordinary market participants have time to react. A creator or associated operator may combine liquidity-related actions with early buys or distribute purchases across several wallets.
In everyday memecoin analysis, the term “bundled supply” is often used more broadly than the technical definition of a single Jito bundle. It can describe supply acquired by a coordinated group of wallets through one or more bundles, same-slot transactions or tightly synchronised purchases.
The important analytical issue is not the technology itself. It is the resulting ownership structure and the behaviour of the wallets that acquired the early supply.
How concentrated supply can appear decentralised
Obvious concentration is easy to detect. If one wallet controls 35 percent of a token’s supply, the risk is visible immediately. Modern operators therefore have an incentive to divide the position between multiple addresses.
Instead of one wallet holding 35 percent, fifty wallets could hold smaller positions. Individually, none of them appears dominant. Together, they may represent a substantial share of the tradable supply.
The token’s holder page can then look relatively healthy. The top ten holders may control an acceptable percentage, and no single address appears capable of destabilising the market.
This appearance changes when the wallets are analysed as a cluster.
If multiple addresses were funded from the same source, entered during the same narrow time window and later sell in a coordinated way, treating them as independent holders becomes misleading. Their combined position may carry the same market risk as one visible whale wallet.
This is why flat holder rankings are no longer sufficient for advanced Solana memecoin analysis.
Why the top ten holders metric can miss the real risk
Top-holder concentration remains a useful metric, but it measures visible address concentration rather than coordinated control.
Consider a token where the ten largest wallets collectively hold 18 percent of the supply. At first glance, the distribution may appear relatively balanced. However, another thirty smaller wallets could have been funded by the same source and acquired an additional 22 percent during the launch.
None of those wallets needs to appear near the top of the holder list. The combined cluster can still control enough supply to create significant selling pressure.
The limitation is structural. A holder ranking evaluates wallets individually, while coordinated strategies operate across relationships.
To understand the actual risk, the analysis must move from a list to a network.
Shared funding lineage
One of the strongest signals connecting apparently independent wallets is a shared funding source.
New wallets need SOL to pay transaction fees and purchase tokens. If several early holders receive their initial funding from the same address, exchange withdrawal or intermediary chain of wallets, the relationship deserves further examination.
A direct funding connection does not prove malicious intent. A trading service, shared treasury or legitimate distribution process may also fund multiple wallets. The signal becomes more meaningful when it appears together with other behavioural similarities.
For example, a group of fresh wallets funded from the same source may all buy the same token within a short period, hold no meaningful history outside that token and later send assets toward the same destination. The combination creates a much stronger indication of coordinated ownership than any single metric alone.
Funding analysis therefore helps reveal relationships that a standard holder page cannot show.
Same-slot and tightly synchronised purchases
Timing provides another important layer of evidence.
Solana processes transactions quickly, and several wallets purchasing the same token within the same slot may indicate automated or coordinated execution. The signal becomes stronger when the wallets are new, share funding relationships or acquire similar position sizes.
Not every simultaneous purchase is suspicious. Popular launches attract bots, snipers and independent traders competing to enter as quickly as possible. High activity around a major token can naturally produce multiple purchases within the same slot.
This is why timing should not be evaluated in isolation.
The relevant question is whether the transaction timing aligns with other signs of common control. Same-slot purchases, shared funding, similar wallet age and coordinated exits form a much more informative pattern than transaction speed alone.
Fresh-wallet patterns
Fresh wallets are common in crypto, particularly among traders who separate strategies or create new addresses for privacy and operational security. A newly created wallet is therefore not automatically dangerous.
The risk changes when a large proportion of a token’s early holders consists of fresh wallets with nearly identical behavioural profiles.
A manufactured holder base may include addresses that were funded shortly before launch, purchased only one token and performed no other meaningful on-chain activity. Individually, each address looks small. Collectively, the group can create an artificial impression of broad adoption.
Wallet age and transaction history help analysts distinguish between established market participants and addresses created specifically for one coordinated operation.
Once again, the value comes from combining signals rather than relying on a single threshold.
Synchronised exits reveal relationships
Wallet relationships are sometimes difficult to confirm during the accumulation phase. They can become more visible when selling begins.
Independent traders rarely make identical decisions at precisely the same time. Their position sizes, objectives and risk tolerance differ. A group of wallets selling within the same narrow sequence of slots, routing proceeds through related addresses or exiting in similar proportions may indicate common control.
Synchronous exits can turn an apparently distributed holder base into a concentrated source of selling pressure.
This is especially important when a connected cluster remains active and continues holding a large percentage of the supply. A historical cluster that has already exited may no longer represent the same immediate risk. An active cluster controlling substantial unsold supply can function like a loaded position waiting to reach the market.
Cluster status therefore matters as much as cluster size.
Bundled activity is not automatically malicious
A professional analytical process must avoid treating every bundle, fresh wallet or simultaneous transaction as proof of fraud.
Solana is an automated, high-speed blockchain. Trading bots are common. Market makers may operate several wallets. Launch platforms can create predictable transaction patterns. Independent participants may enter within the same slot during high-demand events.
Overly aggressive detection can produce false positives and reject legitimate opportunities.
The purpose of bundle detection is not to label every coordinated pattern as malicious. It is to provide context and identify situations requiring deeper examination.
A useful risk model should evaluate multiple dimensions: funding relationships, timing, wallet history, accumulated supply, exit behaviour and the economic role of the connected wallets.
The result should be a risk assessment, not an unsupported accusation.
From holder analysis to wallet-cluster intelligence
Traditional token analysis asks which wallets hold the largest positions. Cluster intelligence asks which wallets behave as a connected system.
This requires a different data model.
Instead of displaying addresses only as rows in a table, the system maps relationships between them. Wallets become nodes. Funding transfers, token purchases, asset movements and synchronised actions become connections.
The resulting graph can reveal structures that are invisible in a conventional ranking. Several small wallets may form one large cluster. A deployer wallet may connect indirectly to early buyers through funding intermediaries. A group of holders may share an exit destination despite appearing unrelated during accumulation.
Graph-based analysis does not replace holder statistics. It makes them more accurate by adding context.
How XSolanaBot can use cluster analysis
For XSolanaBot, wallet-cluster intelligence can extend the analysis beyond simple holder concentration.
A token profile could show the visible number of holders alongside an estimated number of independent wallet clusters. It could highlight the percentage of supply associated with connected addresses, identify shared funding sources and distinguish active clusters from those that have already exited.
The system could also analyse whether early purchases occurred in the same slot, whether wallets were created shortly before launch and whether their selling activity became synchronised.
This would allow traders to compare two different views of the token.
The first view would show the public distribution: the number of addresses and the percentage held by the largest individual wallets.
The second would show the behavioural distribution: the relationships between those addresses and the potential concentration hidden inside clusters.
That difference can materially change how a token is evaluated.
Better questions for analysing holder quality
Instead of asking only how many holders a Solana memecoin has, traders should ask whether those holders behave independently.
Where did the early wallets receive their SOL?
How close together were their initial purchases?
Were the wallets active before the token launched?
Do they hold other assets and interact with unrelated protocols?
Are several addresses routing funds toward the same destination?
Do their exits occur independently or as one coordinated event?
These questions do not guarantee a perfect answer, but they reduce the risk of mistaking manufactured distribution for organic participation.
Final thoughts
Holder count remains an important Solana memecoin metric, but it should not be interpreted as proof of decentralised ownership.
Five hundred wallet addresses do not necessarily represent five hundred independent participants. Supply can be divided across multiple accounts, and a coordinated cluster may remain hidden beneath an apparently healthy holder distribution.
Advanced analysis therefore needs to go beyond counting wallets. It should trace funding, compare transaction timing, examine wallet history and map behavioural relationships.
The holder table shows where tokens are stored.
Cluster analysis helps explain who may actually control them.